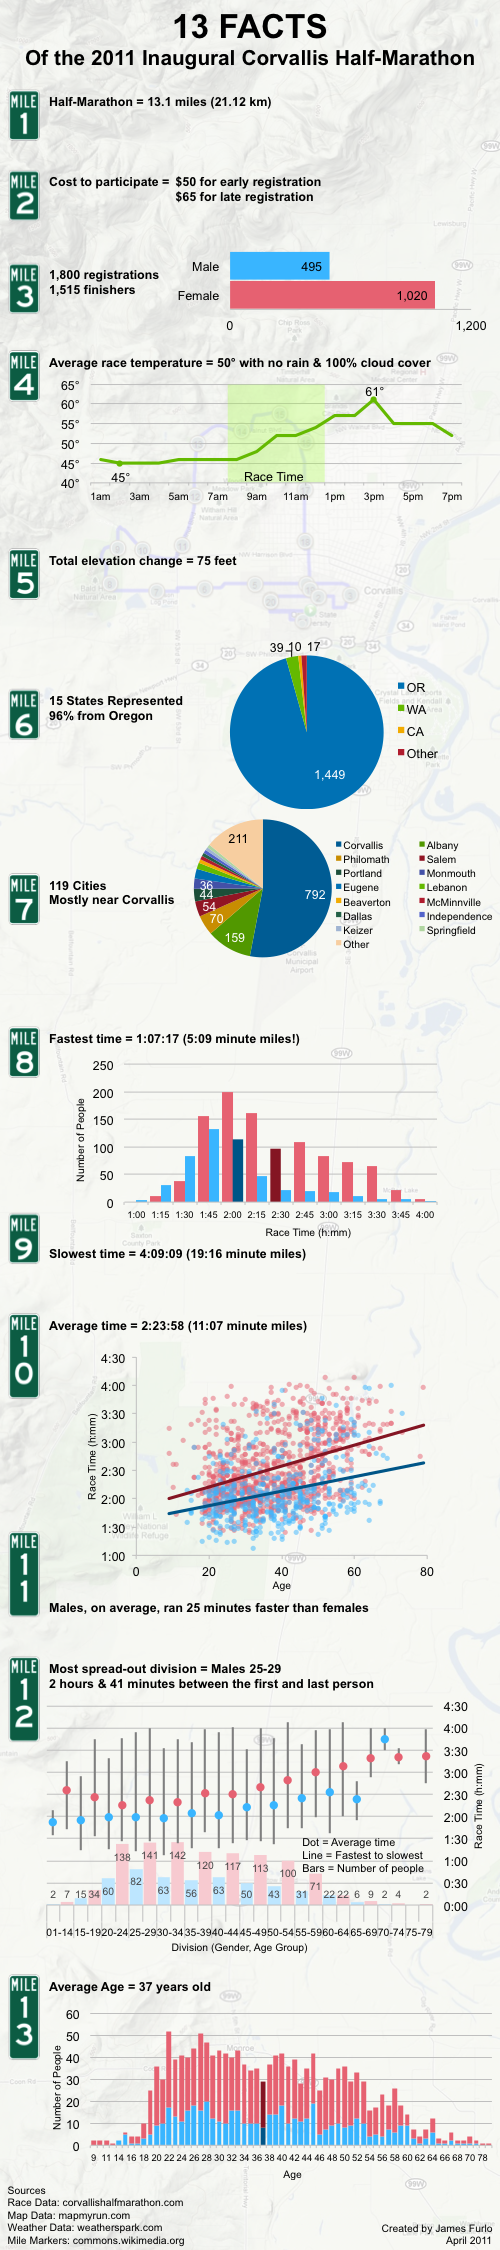
Jessi and I participated in the inaugural Corvallis half-marathon this month. I saw the published results and thought something cool could be done with all that data. I've always enjoyed infographics, and wanted to try making one - this seemed like a perfect opportunity. So, here are 13 facts in honor of the 13 mile race.
(You can click the image to see it full-size and/or download it)

(You can click the image to see it full-size and/or download it)
For those of you who like to know such things. I housed all the data in Excel (it was originally in a PDF, I'm so thankful for the text-column feature in Excel) and created views using a pivot table. I made the final charts in Excel and copied them into PowerPoint. I added my own comments and pictures - nothing too fancy. I saved the final slide as a PNG and uploaded it to my server. And now you're reading it somewhere in the world. Pretty neat!
I wasn't able to participate "this year." However, I am looking forward to next year's event. Great information you have provided. Thank you!
ReplyDeleteVery cool summary. Thanks.
ReplyDeleteThanks Julie and Wendy. I'm glad you like it.
ReplyDeleteVery cool summary. Thanks.
ReplyDelete